As I do every year, I compile and analyze all of the sales in Coconut Grove (per MLS data – which takes me several weeks) over the previous year and look at where our community is trending. The start to 2021 has been a bit different for me compared to previous years as my wife and I had a new baby girl in January, so the start to this new year has been very busy for me and my family…my apologies for the delay.
I am a Groveite through and through. I met my wife in the Grove 11 years ago, was married in the Grove (St. Hugh), my reception was in the Grove (Villa Woodbine), I have lived in the Grove for the past 11 years, and I am the Senior Director of Luxury Sales at Douglas Elliman in our Grove office at Two CocoWalk. I have put together this report for the past 7 years because I care about the health of our community and helping people understand where the Grove housing market has been and is headed.
The overall market in South Florida exploded in 2020 due to an enormous influx of buyers from New York, Chicago and L.A. triggered by Covid in large part because of “the way our city is being run” – (I lumped many, many different people into that one sentence as that was a very common answer when asking buyers “why Florida?”).
The Coconut Grove real estate market had increased year-over-year for 7 consecutive years until it slowed in 2019, but then exploded in 2020. Here are some takeaways from the 2020 numbers:
- Total sales volume in ALL of the Grove set a new all-time high at $541,812,781, shattering the previous high of $511,592,369 from 2018.
- The average sales price per square foot in ALL of the Grove also set a new all-time high at $459.27, besting the previous high of $446.51 from 2018.
- The median sales price in ALL of the Grove also set a new all-time high at $811,000, an 8.5% jump from the previous high of $747,500 from 2019.
- Center Coconut Grove seemed to have the biggest jumps with BOTH its average & median sales prices jumping a whopping 19.9% & 25.8%, respectively.
Coconut Grove Real Estate – Months of Supply
Months of supply means how long it would take for the market to absorb all real estate, if no additional real estate came on the market. This stat determines whether it is a Buyer’s Market or Seller’s Market. When looking at statistics, having a 6-month supply or less favors sellers while more than 6 months favors buyers.
Single-Family Homes: 4.4-Month Supply (Heavy Seller’s Market)
95 Currently Available
130 Sold in Past 6 Months
Condos: 9-Month Supply (Slight Buyer’s Market)
172 Currently Available
114 Sold in Past 6 Months
Townhomes: 4.2-Month Supply (Heavy Seller’s Market)
32 Currently Available
46 Sold in Past 6 Months
*All 3 categories above are the lowest of any period in Coconut Grove’s history*
Below, I have laid out all of the 2020 Coconut Grove real estate statistics and then a year-over-year comparison of 2020 versus 2019.
2020 Coconut Grove Real Estate Sales by the Numbers:
- Total Number of Sales: 492
- Total Sales Volume: $541,812,781
- Average List Price: $1,188,287
- Median List Price: $875,000
- Average Sales Price: $1,101,245 (92.7% of List Price)
- Median Sales Price: $811,000 (92.7% of List Price)
- Average Sales Price Per SQ/FT: $459.27
- Median Sales Price Per SQ/FT: $410.28
- Days on Market: 123 Average / 73 Median
- Highest Priced Sale of 2020: Grove at Grand Bay #1901S Closed on 08/31/2020 @ $8,032,500 ($1,365.14 per sq/ft)
- Lowest Priced Sale of 2020: 3615 Thomas Ave. Closed on 12/07/2020 @ $85,000 ($180.85 per sq/ft)
Download: 2020 ALL Coconut Grove Closed Real Estate Sales
2020 vs. 2019 ALL Coconut Grove Sales Year-Over-Year Numbers:
- Total Number of Sales: EQUAL (+4.7%) | 492 in 2020 vs. 492 in 2019 (470 in 2018)
- Total Sales Volume: UP $65,578,105 (+13.8%) | $541,812,781 in 2020 vs. $476,234,676 in 2019 ($511,592,369 in 2018)
- Average List Price: UP $144,876 (+13.9%) | $1,188,287 in 2020 vs. $1,043,411 in 2019 ($1,183,965 in 2018)
- Median List Price: UP $76,500 (+9.6%) | $875,000 in 2020 vs. $798,500 in 2019 ($759,460 in 2018)
- Average Sales Price: UP $133,008 (+13.7%) | $1,101,245 in 2020 vs. $968,237 in 2019 ($1,088,494 in 2018)
- Median Sales Price: UP $63,500 (+8.5%) | $811,000 in 2020 vs. $747,500 in 2019 ($725,000 in 2018)
- Average Sales Price Per SQ/FT: UP $27.35 (+6.3%) | $459.27 in 2020 vs. $431.92 in 2019 ($446.51 in 2018)
- Median Sales Price Per SQ/FT: UP $16.58 (+4.2%) | $410.28 in 2020 vs. $393.70 in 2019 ($396.10 in 2018)
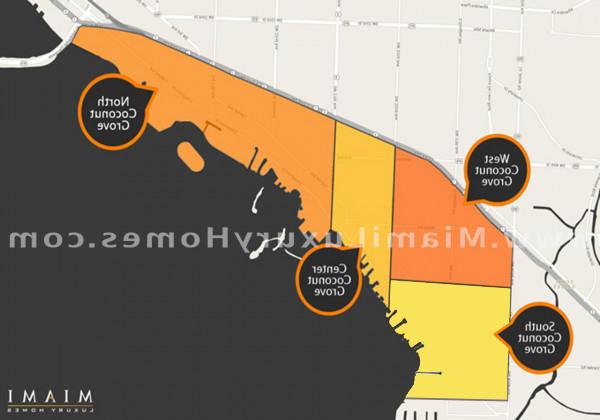
To local Groveites looking to sell, and buyers purchasing property in Coconut Grove, I have broken down the statistics of the different areas of the Grove. Coconut Grove is locally referred to in parts, i.e. North, South, Center and West (for example, CocoWalk and the Mayfair Hotel & Spa are both located in Center Grove and Kennedy Park is located in North Grove).
2020 vs. 2019 NORTH Coconut Grove Sales by the Numbers:
- Total Number of Sales: 192 in 2020 | 159 in 2019 (127 in 2018)
- Average List Price: $1,427,992 in 2020 | $1,350,959 in 2019 ($1,542,612 in 2018)
- Median List Price: $1,100,000 in 2020 | $1,149,000 in 2019 ($1,130,000 in 2018)
- Average Sales Price: (+5.0%) $1,303,196 in 2020 | $1,241,543 in 2019 ($1,416,833 in 2018)
- Median Sales Price: (+1.0%) $1,050,000 in 2020 | $1,040,000 in 2019 ($1,050,000 in 2018)
- Average Sales Price Per SQ/FT: (-2.2%) $473.26 in 2020 | $483.65 in 2019 ($517.90 in 2018)
- Median Sales Price Per SQ/FT: (+0.4%) $436.72 in 2020 | $435.19 in 2019 ($451.15 in 2018)
- Days on Market: 154 Average | 101 Median in 2020 (166 Average | 103 Median in 2019)
- Highest Priced Sale of 2020: Grove at Grand Bay #1901S Closed on 08/31/2020 @ $8,032,500 ($1,365.14 per sq/ft)
- Lowest Priced Sale of 2020: 3071 SW 27th Ave. #10 Closed on 02/11/2020 @ $140,000 ($276.13 per sq/ft)
Download: 2020 NORTH Coconut Grove Closed Real Estate Sales
2020 vs. 2019 SOUTH Coconut Grove Sales by the Numbers:
- Total Number of Sales: 54 in 2020 | 49 in 2019 (67 in 2018)
- Average List Price: $2,003,343 in 2020 | $1,727,041 in 2019 ($2,210,348 in 2018)
- Median List Price: $1,519,000 in 2020 | $1,299,000 in 2019 ($1,690,000 in 2018)
- Average Sales Price: (+17.1%) $1,878,919 in 2020 | $1,605,041 in 2019 ($2,033,042 in 2018)
- Median Sales Price: (+13.3%) $1,387,500 in 2020 | $1,225,000 in 2019 ($1,540,000 in 2018)
- Average Sales Price Per SQ/FT: (+17.3%) $538.08 in 2020 | $458.62 in 2019 ($509.04 in 2018)
- Median Sales Price Per SQ/FT: (+15.1%) $501.22 in 2020 | $435.30 in 2019 ($478.84 in 2018)
- Days on Market: 106 Average | 54 Median in 2020 (137 Average | 92 Median in 2019)
- Highest Priced Sale of 2020: 3604 Matheson Ave. Closed on 07/14/2020 @ $6,680,000 ($998.06 per sq/ft)
- Lowest Priced Sale of 2020: 4195 Park Ave. Closed on 01/10/2020 @ $625,000 ($692.90 per sq/ft)
Download: 2020 SOUTH Coconut Grove Closed Real Estate Sales
2020 vs. 2019 CENTER Coconut Grove Sales by the Numbers:
- Total Number of Sales: 155 in 2020 | 174 in 2019 (197 in 2018)
- Average List Price: $765,628 in 2020 | $638,003 in 2019 ($759,332 in 2018)
- Median List Price: $589,000 in 2020 | $464,950 in 2019 ($535,000 in 2018)
- Average Sales Price: (+19.9%) $717,214 in 2020 | $598,390 in 2019 ($691,480 in 2018)
- Median Sales Price: (+25.8%) $560,000 in 2020 | $445,000 in 2019 ($510,000 in 2018)
- Average Sales Price Per SQ/FT: (+10.6%) $447.12 in 2020 | $404.42 in 2019 ($405.21 in 2018)
- Median Sales Price Per SQ/FT: (+3.7%) $387.17 in 2020 | $373.52 in 2019 ($352.66 in 2018)
- Days on Market: 104 Average | 60 Median in 2020 (199 Average | 72 Median in 2019)
- Highest Priced Sale of 2020: 3309 Devon Ct. Closed on 12/17/2020 @ $7,725,000 ($1,365.08 per sq/ft)
- Lowest Priced Sale of 2020: 3242 Mary St. #S-315 Closed on 12/21/2020 @ $152,000 ($299.80 per sq/ft)
Download: 2020 CENTER Coconut Grove Closed Real Estate Sales
2020 vs. 2019 WEST Coconut Grove Sales by the Numbers:
- Total Number of Sales: 92 in 2020 | 110 in 2019 (79 in 2018)
- Average List Price: $913,367 in 2020 | $933,300 in 2019 ($816,700 in 2018)
- Median List Price: $787,500 in 2020 | $796,500 in 2019 ($650,000 in 2018)
- Average Sales Price: (-1.2%) $862,709 in 2020 | $872,832 in 2019 ($769,799 in 2018)
- Median Sales Price: (-2.5%) $760,000 in 2020 | $779,500 in 2019 ($615,000 in 2018)
- Average Sales Price Per SQ/FT: (+3.2%) $402.47 in 2020 | $389.88 in 2019 ($381.78 in 2018)
- Median Sales Price Per SQ/FT: (+5.9%) $388.44 in 2020 | $366.74 in 2019 ($360.02 in 2018)
- Days on Market: 98 Average | 53 Median in 2020 (175 Average | 135 Median in 2019)
- Highest Priced Sale of 2020: 4160 Raynolds Ave. Closed on 09/29/2020 @ $3,015,000 ($781.09 per sq/ft)
- Lowest Priced Sale of 2020: 3615 Thomas Ave. #11 Closed on 12/07/2020 @ $85,000 ($180.85 per sq/ft)
Download: 2020 WEST Coconut Grove Closed Real Estate Sales
If you, or someone you know, would like to purchase or sell real estate in Coconut Grove, please contact me, Michael Light, Founder/Owner of the Light Group at Douglas Elliman Real Estate. I am a resident of Coconut Grove and have direct knowledge of the Coconut Grove real estate market. You may reach me directly at my CocoWalk office at 305-350-9842, on my cell phone at 786-566-1700 or via email at michael@sydotnet.net.
Looking for past Coconut Grove market statistic articles? Here they are:
2019 Coconut Grove Market Report
2018 Coconut Grove Market Report
2017 Coconut Grove Market Report
2016 Coconut Grove Market Report
2015 Coconut Grove Market Report
2014 Coconut Grove Market Report


